The Automation Paradox: Who Really Gets Hurt When AI Takes Over?
AI’s Impact on the Job Market
Executive Summary
This report analyzes AI’s effect on the US labor market using three datasets: Frey & Osborne’s automation probability scores (2013), BLS 2024–2034 employment projections, and the ILO’s 2025 Generative AI Occupational Exposure Index.
The Automation Paradox: most workers exposed to AI are currently seeing stable or growing employment. Yet hidden inside that aggregate is a concentrated crisis. np.int64(144) occupations (24% of analyzed jobs) combine high automation risk with low wages and low education which leaves workers with no economic safety net. These are the jobs where displacement is not a future concern but a present reality.
Key findings:
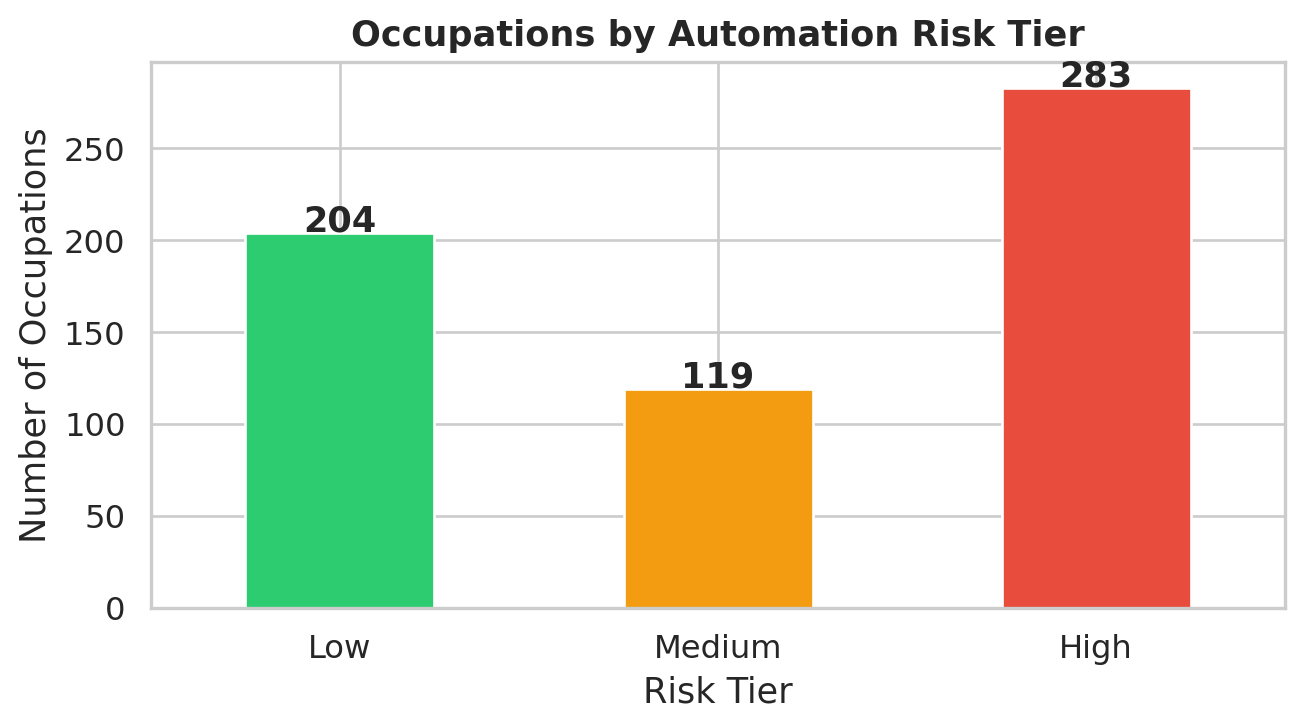
- np.int64(283) of 606 matched occupations carry high (≥70%) automation risk — primarily in Office & Admin Support, Production, and Food Preparation
- High-risk occupations have a median wage of $48,350 — compared to $79,000 for low-risk occupations
- A linear regression confirms automation risk negatively predicts employment growth (coefficient: −4.60), but the full model (automation risk + adaptive capacity + occupation group) explains only R² = 0.166 of variance on the test set — automation is predictive but not deterministic
- Adaptive capacity (wage + education combined) is a significant protective factor: workers with higher adaptive capacity scores see meaningfully better employment outcomes, independent of their automation exposure
- A “Then vs. Now” comparison using the ILO 2025 GenAI Exposure Index reveals the risk map has fundamentally shifted: Computer & Math reversed from low traditional risk (13%) to highest GenAI exposure (56%), while Production and Construction — flagged as near-certain automation targets in 2013 — score among the lowest on GenAI exposure today.
1. Introduction
Aggregate employment statistics look healthy but averages hide the key distribution. This report investigates which occupations are genuinely at risk, what makes some workers resilient and others vulnerable, and where the US labor market is heading through 2034.
Research Questions
- Which occupations face the highest automation risk, and are those the same occupations projected to decline?
- Does automation risk alone predict employment change, or do other factors matter more?
- Can we identify a “vulnerability cluster” — occupations combining high automation exposure with low adaptive capacity?
2. Data Sources
A note on the original dataset: This project was initially scoped around the AI Impact on Job Market dataset on Kaggle. Preliminary analysis showed near-zero correlations between all variables (r ≈ 0.001–0.012 across every pair), which is a hallmark of randomly generated synthetic data — there is no real signal to analyze. That dataset was set aside in favor of the three real-world sources described below.
Three datasets are combined for this analysis:
| Dataset | Source | Coverage | Role |
|---|---|---|---|
| Automation Probability Scores | Frey & Osborne (2013), The Future of Employment | 702 US occupations | Traditional automation baseline (“then”) |
| Employment Projections 2024–2034 | US Bureau of Labor Statistics | 832 occupations | Employment outlook |
| GenAI Occupational Exposure Index | Gmyrek et al. (2025), ILO Working Paper 140 | 427 ISCO-08 occupations | GenAI exposure (“now”) |
Frey & Osborne and BLS are joined on SOC codes — 86% of F&O’s 702 occupations matched to a BLS entry, producing 606 occupations in the analysis dataset. The ILO dataset uses ISCO-08 codes and is bridged via the BLS official ISCO-08 × SOC crosswalk, covering 600 of the 606 occupations (99% with GenAI scores).
3. Automation Risk Distribution
The distribution is bimodal: occupations pile up at the extremes with relatively few in the middle. This reflects the nature of work itself — tasks tend to be either primarily routine (highly automatable) or primarily non-routine (resistant to automation), with few genuinely ambiguous cases.
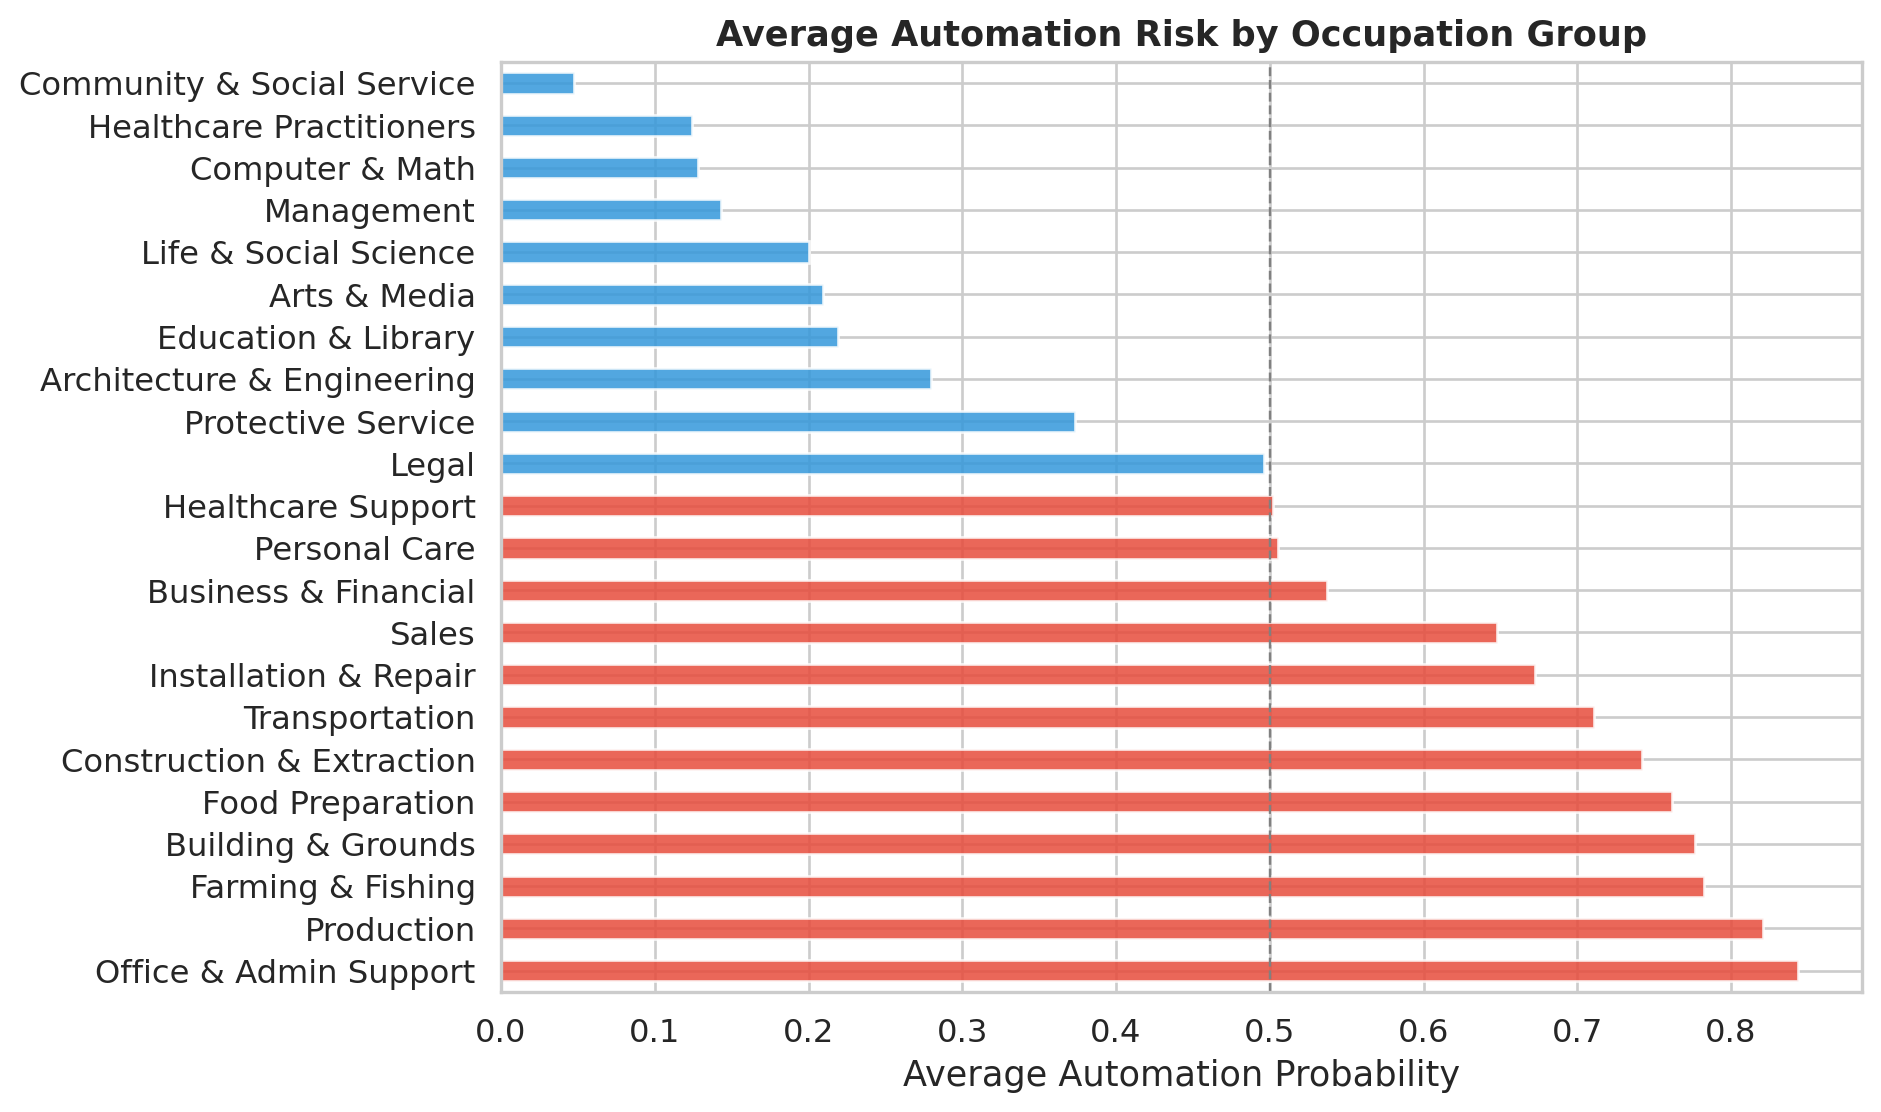
By occupation group, the highest-risk sectors are Office & Administrative Support (84% average probability), Production (82%), Farming & Fishing (78%), and Building & Grounds (78%). The safest sectors are Community & Social Service (5%), Healthcare Practitioners (12%), Computer & Math (13%), and Management (14%).
4. The Core Relationship: Automation Risk vs. Job Growth
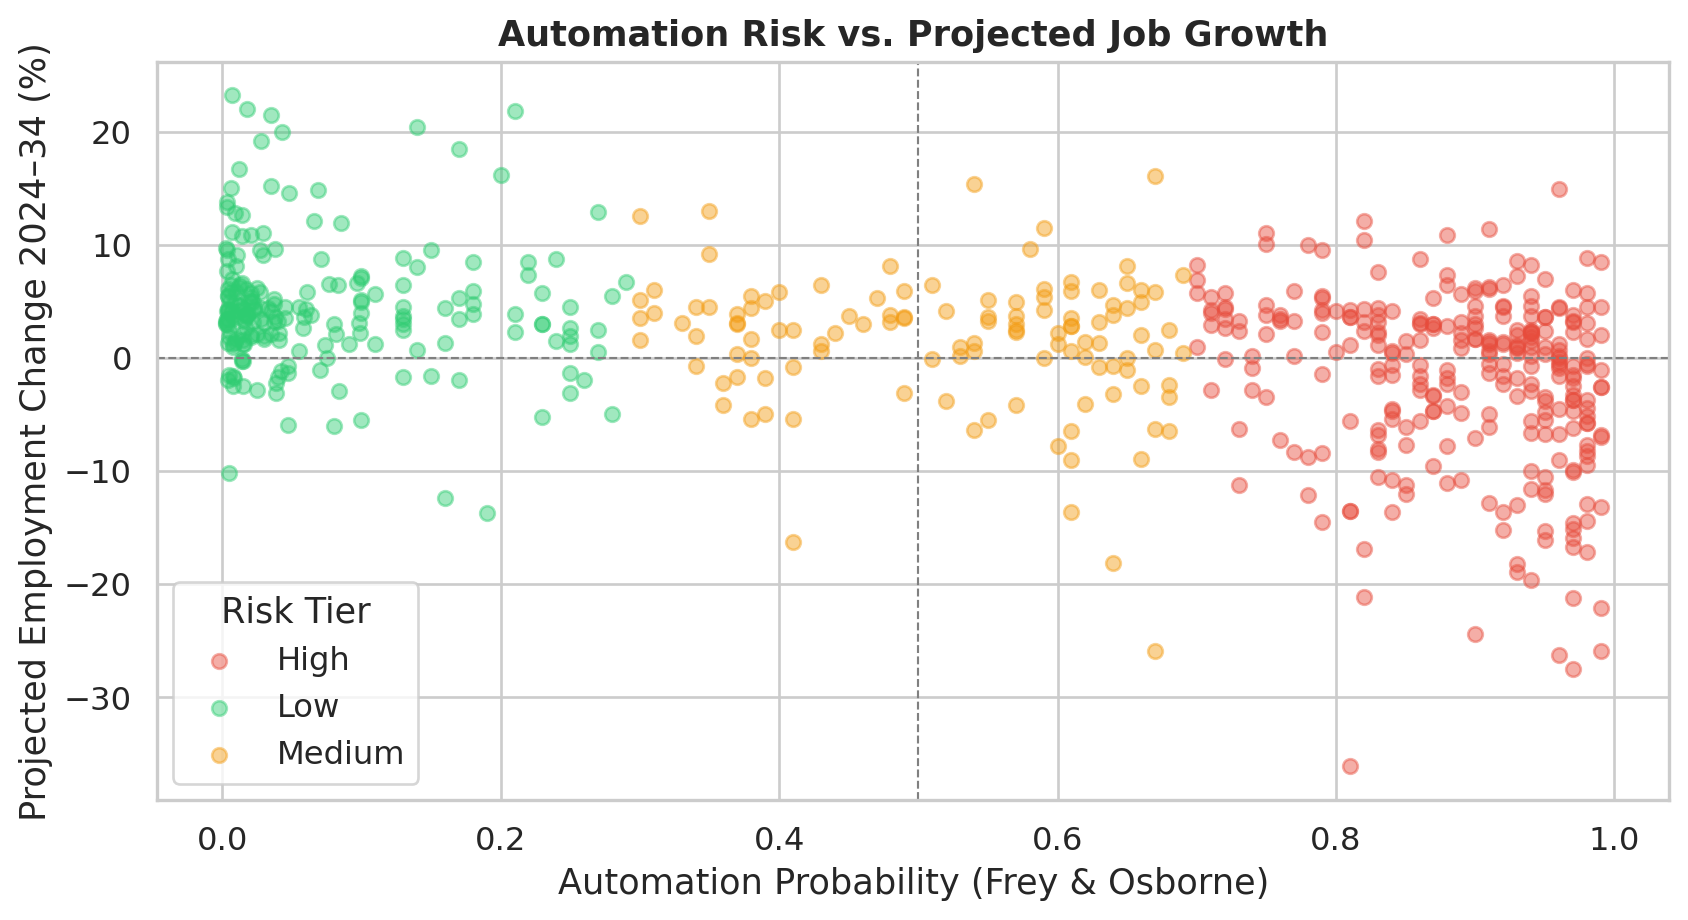
The scatter confirms the pattern from the executive summary but also shows its limits. The negative trend is real — high-automation occupations cluster toward the bottom — but the cloud is wide. Plenty of red dots sit above the zero line.
Correlation: r = −0.414 — moderate, not strong. A linear regression puts a number on it: each 1-point increase in automation probability associates with a −4.60 percentage point drop in projected employment growth, holding sector and adaptive capacity constant.
The harder result is the R². A full model adding adaptive capacity (normalized wage + education combined) and 21 occupation-group dummies explains only 16.6% of variance on the held-out test set. That leaves 83% of the variation in employment outcomes unexplained by any of these factors. Automation exposure matters — it just doesn’t determine outcomes on its own.
5. Who Is Most At Risk?
The most at-risk occupations combine high automation probability (≥70%) with the steepest projected employment declines: word processors and typists (−36%), telephone operators (−28%), data entry keyers (−26%), telemarketers (−22%), and payroll clerks (−17%). These are not hypothetical future risks — BLS projects active job losses in all of them through 2034.
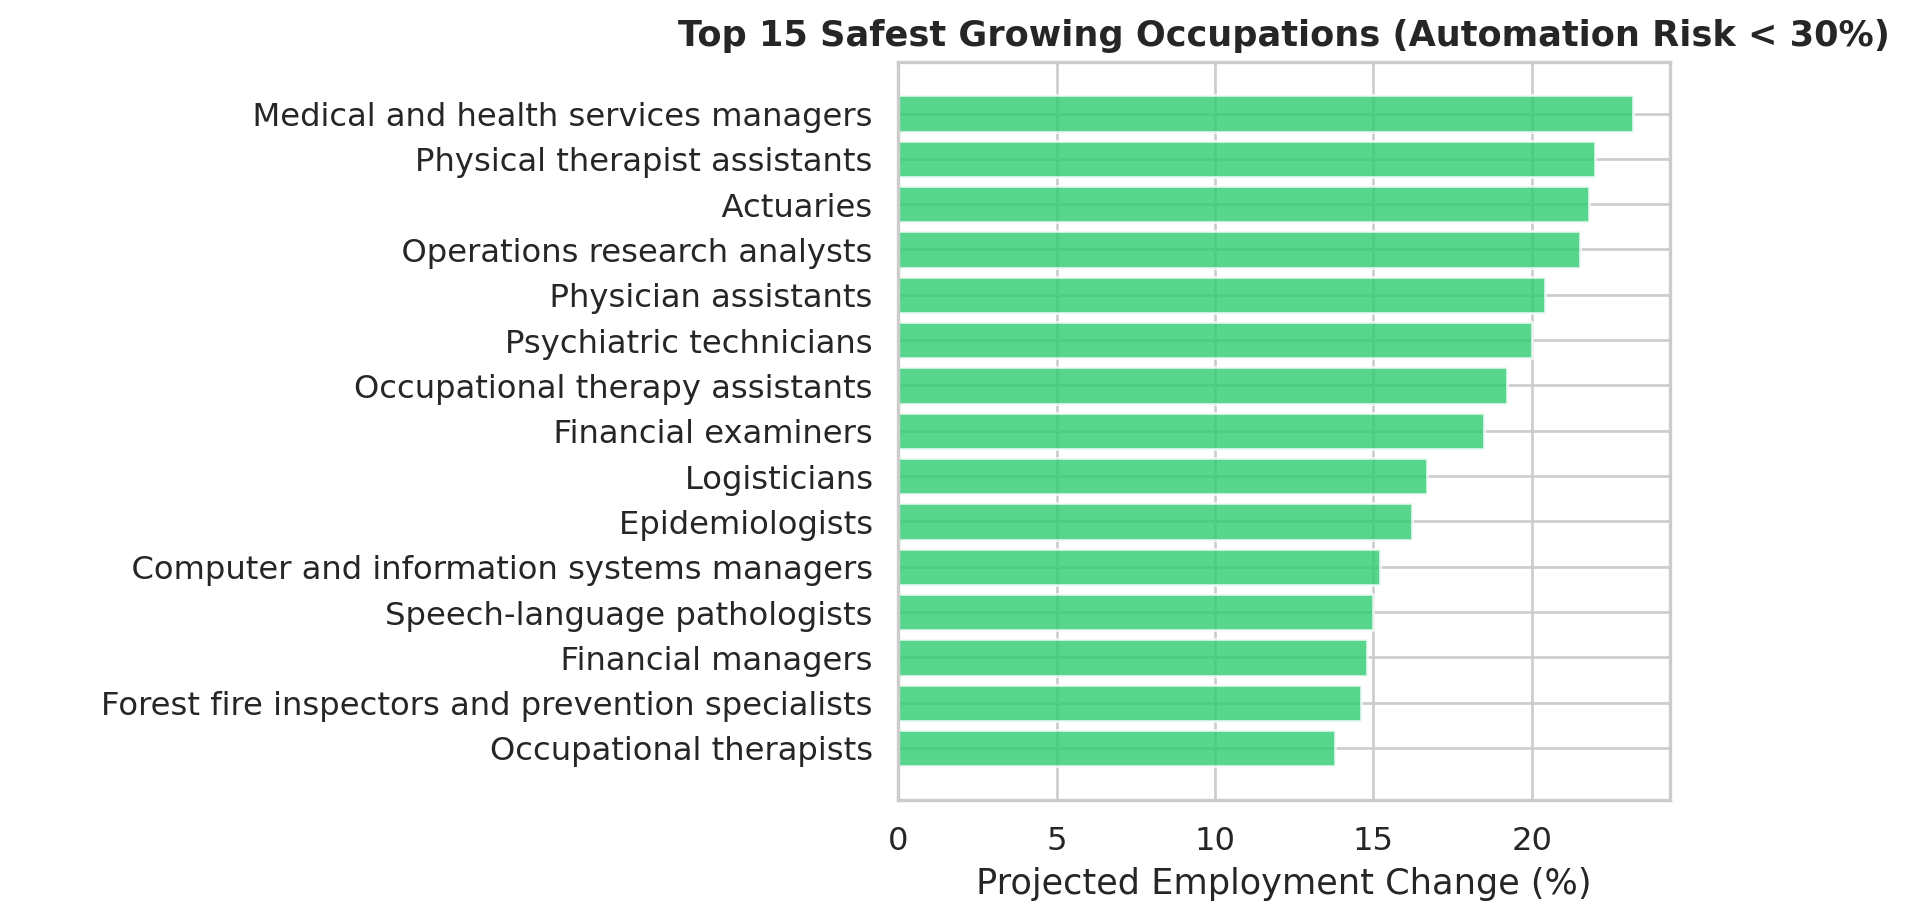
6. The Other End: Who Is Safe?
The safest and fastest-growing occupations split into two groups. Healthcare roles (nurse practitioners, physician assistants, home health aides) are protected by physical presence, human judgment, and the regulatory and relational complexity of patient care. Technology roles (software developers, data scientists) require deep domain expertise and abstract reasoning that current automation cannot replicate at scale. Both groups demand credentials and continuous learning — characteristics that raise the barrier to displacement.
7. The Economic Divide
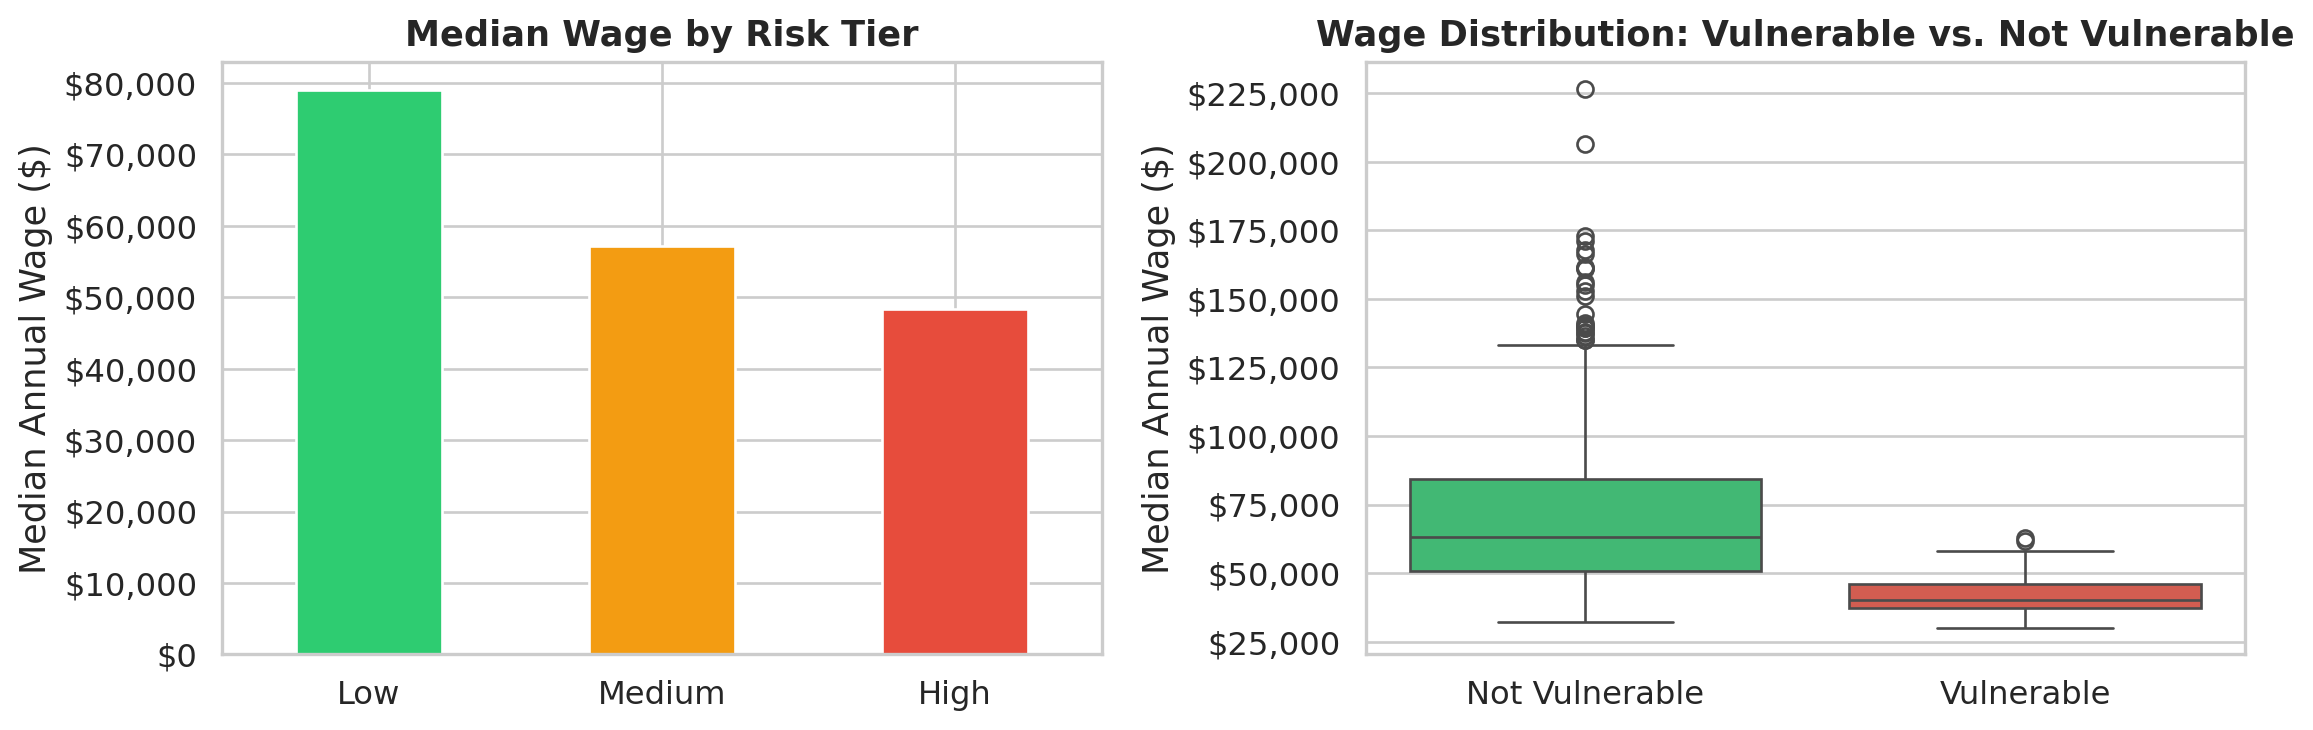
High-risk occupations have a median annual wage of $48,350, compared to $79,000 for low-risk occupations — a $30,650 gap.
The box plot makes the distributional difference even clearer. Vulnerable occupations (high automation + low adaptive capacity) have a tightly compressed wage range centered at $40,260. Non-vulnerable occupations have a median of $63,280 with a wide spread extending into six figures. The workers most threatened by AI are also the least able to afford the retraining, relocation, or career transition that adaptation requires.
8. Cluster Analysis: Three Paths Forward
K-Means clustering reveals three occupational trajectories (elbow analysis suggested k=4, but k=3 produced fully interpretable segments with no loss of structure):
| Size | Avg Automation Prob | Avg Adaptive Capacity | Avg Emp Change % | Avg Wage | |
|---|---|---|---|---|---|
| cluster_label | |||||
| High Risk / Low Resilience | 366 (61.0%) | 80.0% | 0.13 | -1.29% | $51,103 |
| Low Risk / Stable | 151 (25.2%) | 16.0% | 0.35 | +3.80% | $66,986 |
| Low Risk / High Skill | 83 (13.8%) | 12.0% | 0.60 | +5.29% | $121,970 |
The “High Risk / Low Resilience” cluster (61% of matched occupations) faces declining employment with virtually no adaptive buffer. The “Low Risk / High Skill” cluster (14% of occupations) has near-zero automation risk, strong job growth, and wages 2.4× higher than the High Risk / Low Resilience cluster.
9. Then vs. Now: The GenAI Risk Shift (2013 → 2025)
Frey & Osborne (2013) measured automation risk for routine, algorithmic tasks. Generative AI targets different work: language, reasoning, and information synthesis. The ILO’s 2025 GenAI Occupational Exposure Index (Gmyrek et al., ILO Working Paper 140) quantifies that new risk across 29,753 tasks in 427 ISCO-08 occupations.
If the risk landscape has shifted since 2013, policies and career advice built on those assumptions may be protecting the wrong workers.
The Sector-Level Flip
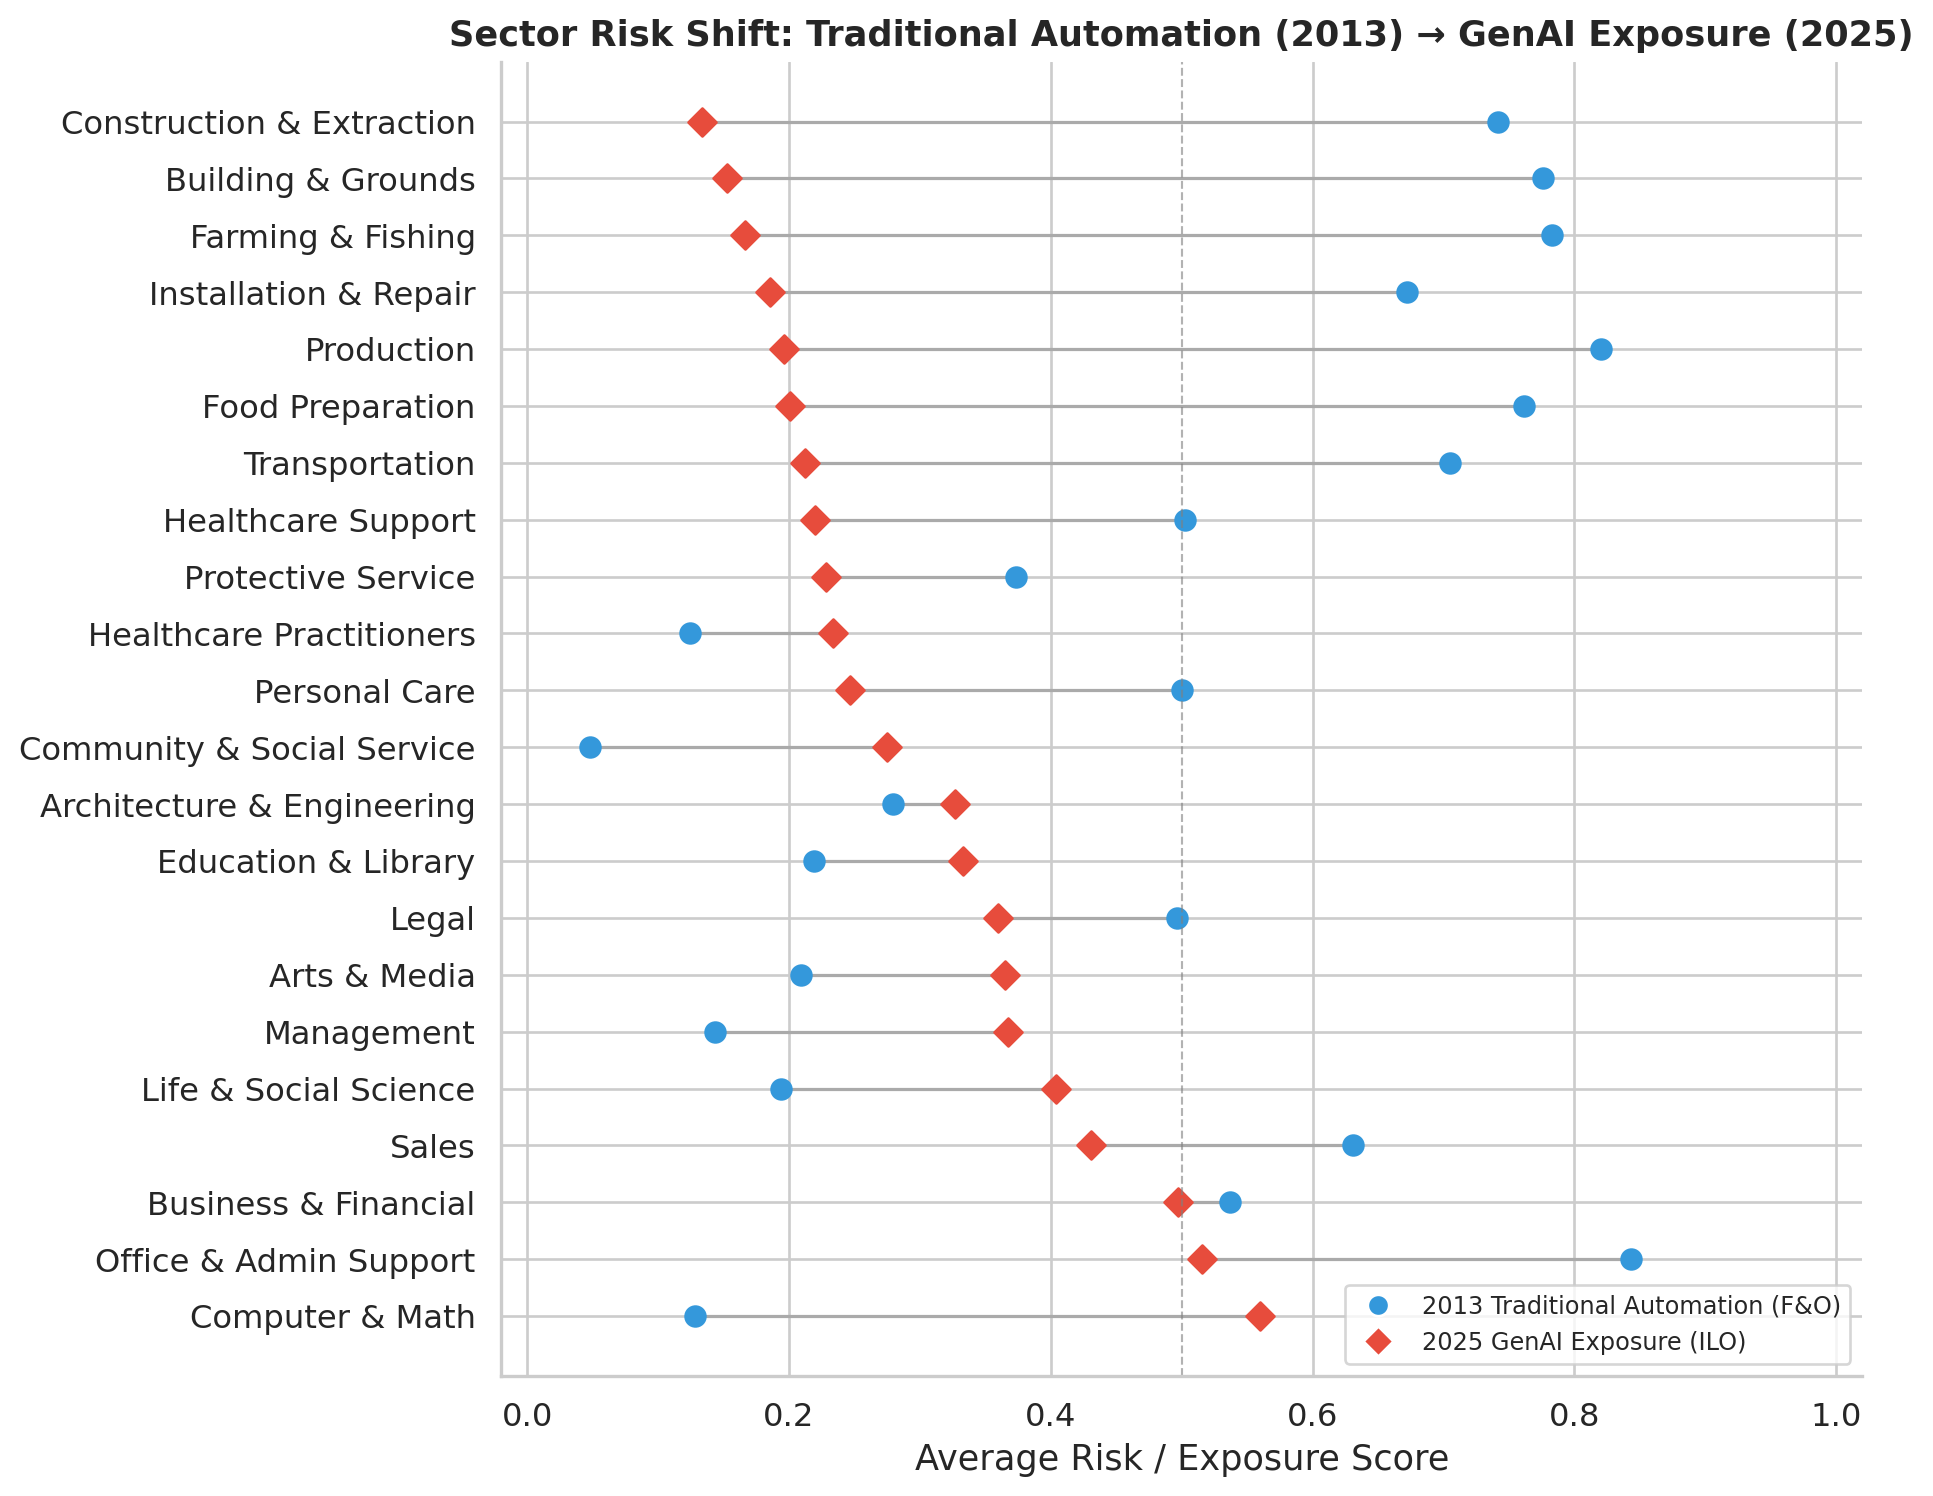
Lines pointing right mark sectors where GenAI exposure rose from 2013 — knowledge and information work that language models target directly. Lines pointing left are physical sectors where GenAI has no displacement mechanism.
The Occupation-Level Picture
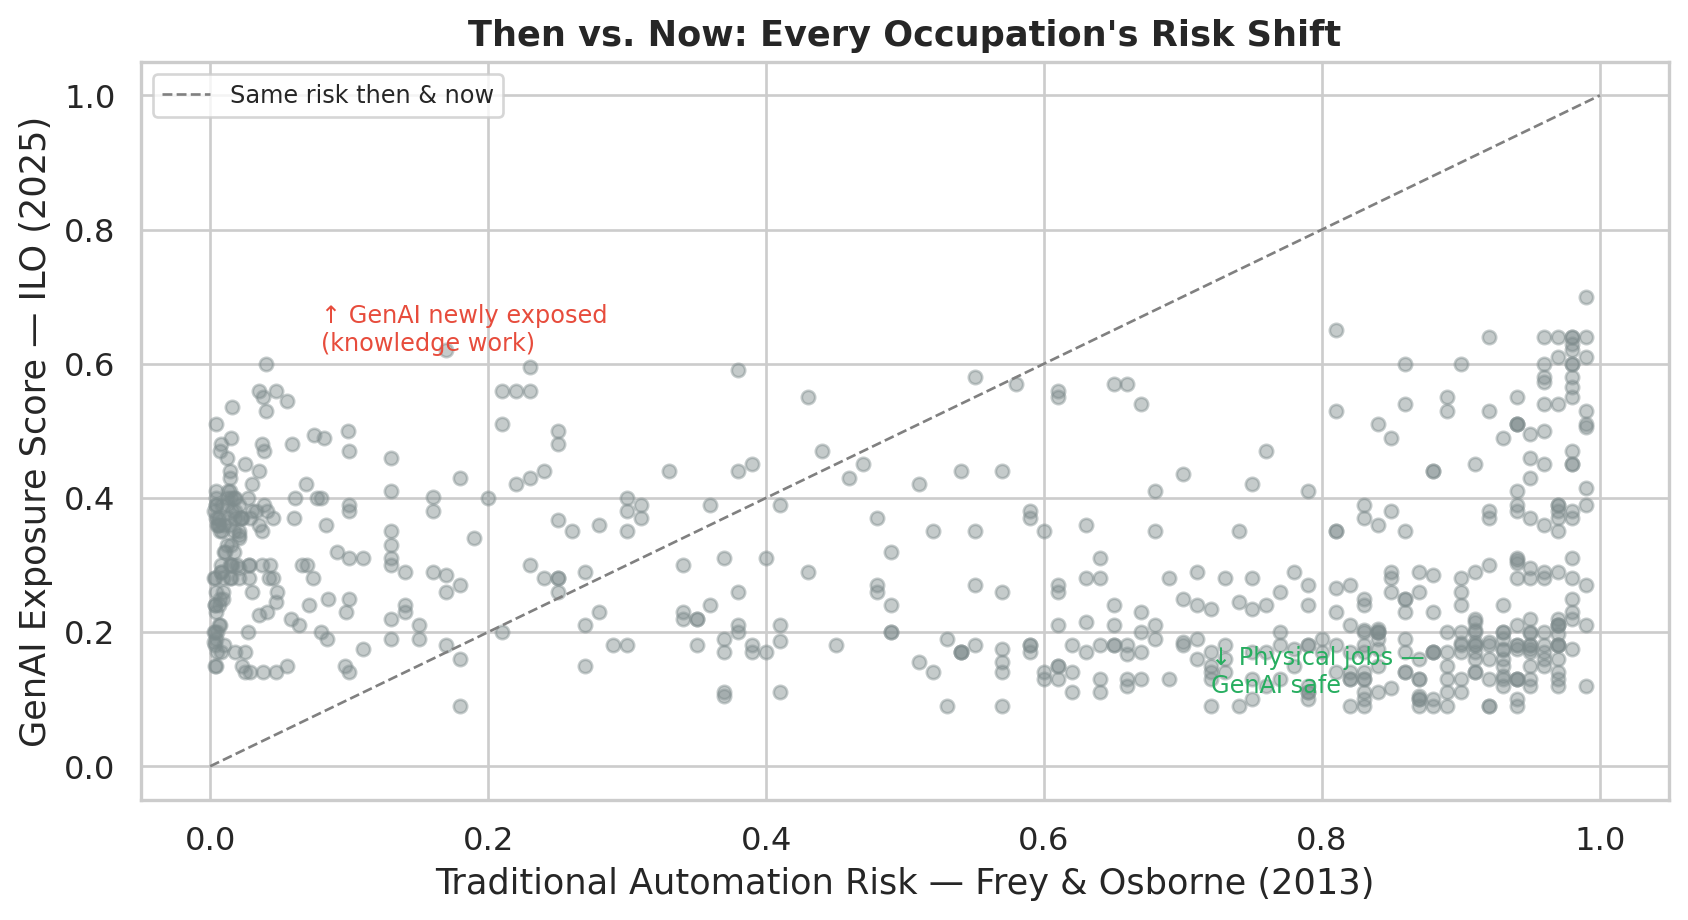
Points above the diagonal face more GenAI exposure than 2013 models predicted. Points below had high traditional automation risk that GenAI does not replicate.
The five most newly exposed occupations (largest positive delta):
| Occupation | Sector | 2013 Risk | GenAI 2025 | Δ |
|---|---|---|---|---|
| Credit counselors | Business & Financial | 4% | 60% | 0.56 |
| Operations research analysts | Computer & Math | 4% | 56% | 0.53 |
| Securities, commodities, and financial services sales agents | Sales | 2% | 54% | 0.52 |
| Mathematicians | Computer & Math | 5% | 56% | 0.51 |
| Writers and authors | Arts & Media | 4% | 55% | 0.51 |
The five most de-risked occupations (largest negative delta):
| Occupation | Sector | 2013 Risk | GenAI 2025 | Δ |
|---|---|---|---|---|
| Sewers, hand | Production | 99% | 12% | -0.87 |
| Log graders and scalers | Farming & Fishing | 97% | 12% | -0.85 |
| Helpers–painters, paperhangers, plasterers, and stucco masons | Construction & Extraction | 94% | 9% | -0.85 |
| Pesticide handlers, sprayers, and applicators, vegetation | Building & Grounds | 97% | 13% | -0.84 |
| Cement masons and concrete finishers | Construction & Extraction | 94% | 10% | -0.84 |
What This Means
Both eras agree on one point: Office & Administrative Support is highly exposed (84% traditional, 52% GenAI). Beyond that, the risk maps diverge.
GenAI targets language, reasoning, and information synthesis, not physical manipulation. Writers, analysts, counselors, and mathematicians appear in the newly-exposed list; brickmasons, sewers, and groundskeepers appear in the de-risked list. The physical dexterity barrier that protected manual workers from robotics also protects them from GenAI.
Retraining programs built on 2013 risk maps may be pointing workers toward newly-exposed roles. A worker retrained from data entry into a general office or analytical role may have moved from one exposed category to another. Healthcare and skilled trades are the lower-risk alternatives from a GenAI standpoint — both require physical presence and human judgment that language models cannot replicate.
10. Conclusions and Policy Implications
Automation risk and employment decline are related (r = −0.414) but not synonymous. Many high-automation occupations still show positive growth projections — the relationship is real but explains a fraction of the variance, and sector-level dynamics, demographic demand, and wage floors all shape outcomes independently of AI exposure.
That aggregate picture obscures a more concentrated problem. np.int64(144) occupations (23.8% of analyzed jobs) combine high automation exposure with wages and education too low to support adaptation. These workers absorb displacement costs with limited ability to transition.
Implications: 1. Targeted retraining, not general retraining. The vulnerable population is identifiable by occupation — Office & Admin Support, Production, Food Preparation. Broadly available training programs miss the specific workers at risk. 2. Wage floors and education must rise together. Low-wage workers cannot access training, relocation, or extended job search even with higher education. Neither lever works alone — income support during transition is as necessary as the training itself. 3. Healthcare investment is a hedge. The fastest-growing, safest occupations are concentrated in healthcare — a sector driven by demographics, not AI adoption. Policies that reduce barriers to healthcare careers (licensing, cost, geographic access) are simultaneously labor market policies.
Limitations: Frey & Osborne’s scores date to 2013 and reflect a pre-GenAI understanding of automation risk — which is why this report includes the ILO 2025 comparison in Section 9. Even so, the ILO scores are global (ISCO-08) and were validated using Polish worker surveys; US-specific GenAI adoption rates may differ. BLS projections are point estimates with unquantified uncertainty. The merged dataset covers 606 of 832 BLS-tracked occupations, because the inner join with F&O’s 702-occupation scope excludes BLS entries with no matching SOC code in the F&O data; 6 of the 606 matched occupations have no ISCO-08 equivalent and are excluded from the then/now analysis only.
References
- Frey, C.B. & Osborne, M.A. (2013). The Future of Employment: How Susceptible Are Jobs to Computerisation? Oxford Martin School Working Paper.
- U.S. Bureau of Labor Statistics (2024). Employment Projections 2024–2034. U.S. Department of Labor. https://www.bls.gov/emp/
- Gmyrek, P., Berg, J., & Bescond, D. (2025). Generative AI and Jobs: A Refined Global Index of Occupational Exposure. ILO Working Paper 140. International Labour Organization. https://www.ilo.org/publications/generative-ai-and-jobs-refined-global-index-occupational-exposure
- Acemoglu, D. & Restrepo, P. (2018). Artificial Intelligence, Automation, and Work. NBER Working Paper 24196.
- Broady, K., McGrew, C., & Ouyang, A. (2024). Measuring US Workers’ Capacity to Adapt to AI-Driven Job Displacement. The Brookings Institution.